Fleet management system
Fleet managment system
One of the activity priorities of the system MOREVIA is the general control system that can be applied not only for one vessel, but for the whole fleet of the customer.
Fleet Management System (FMS) provides all vessels online monitoring from the office.
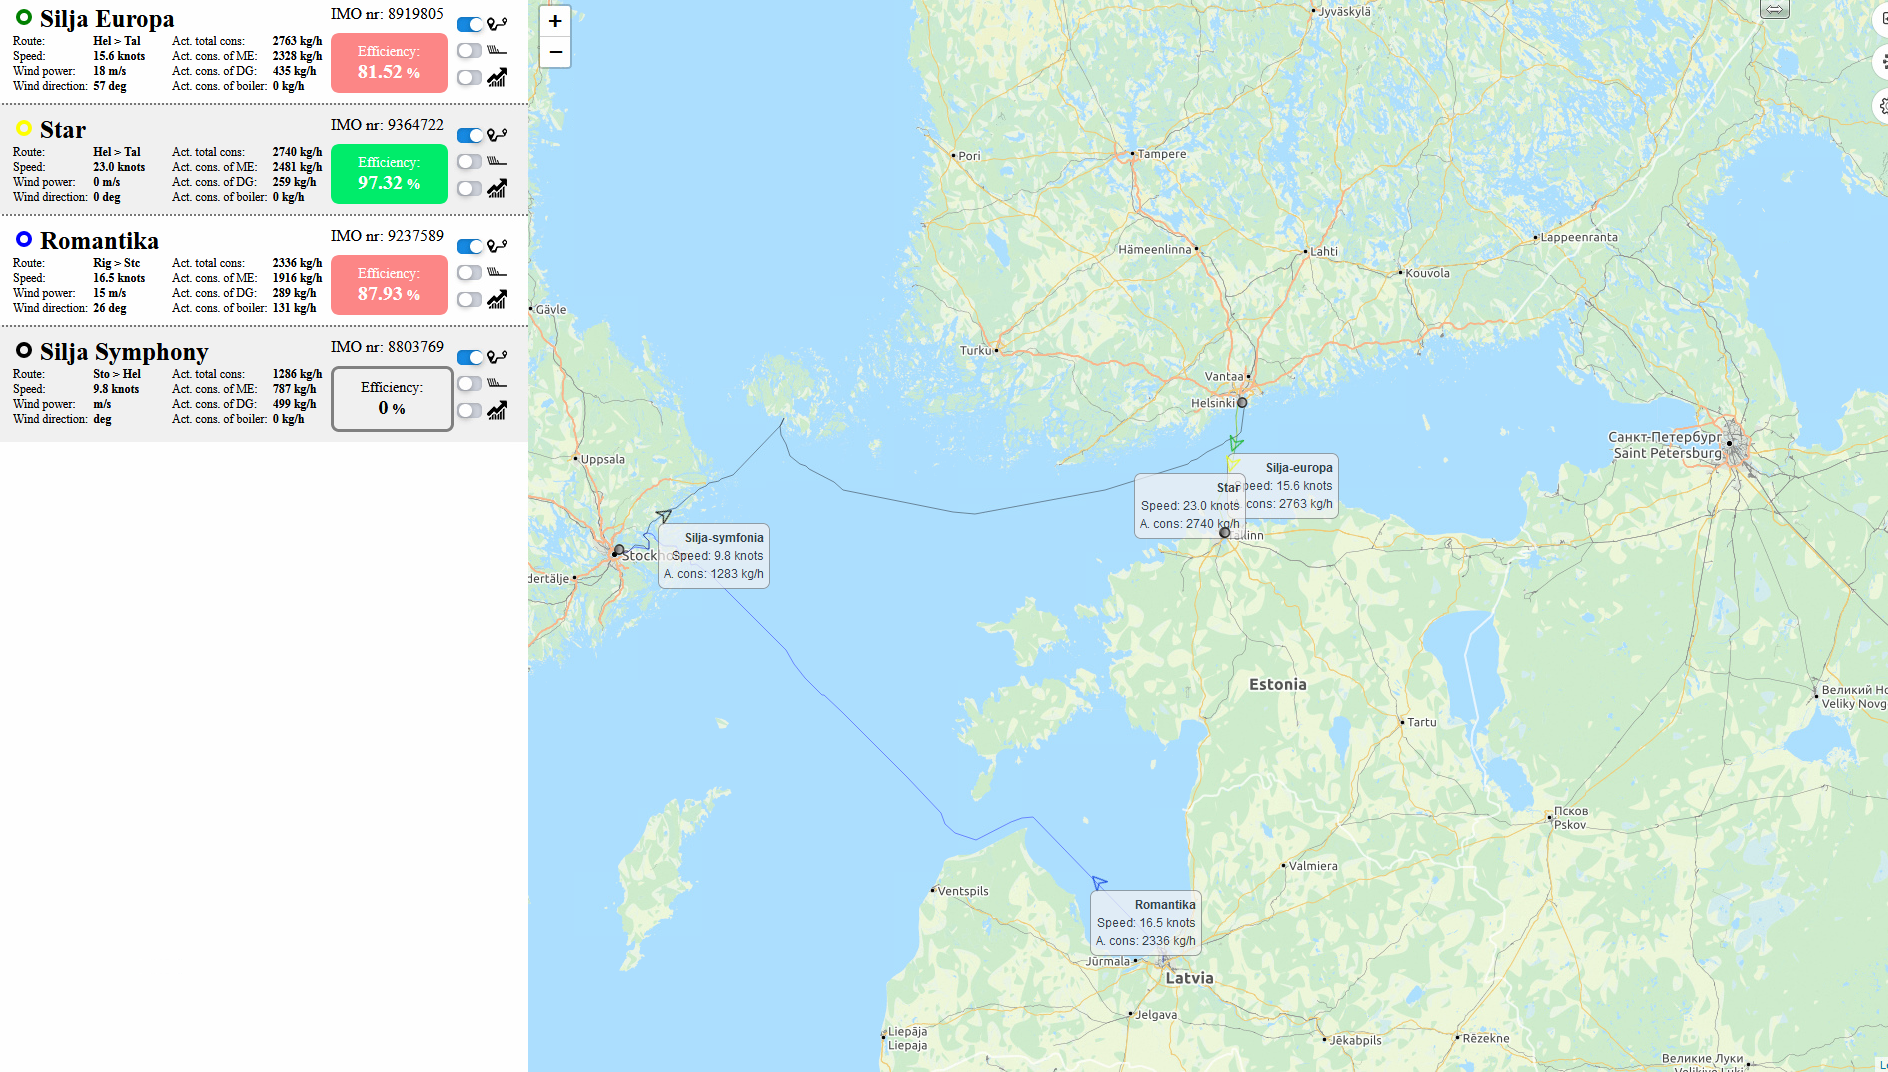
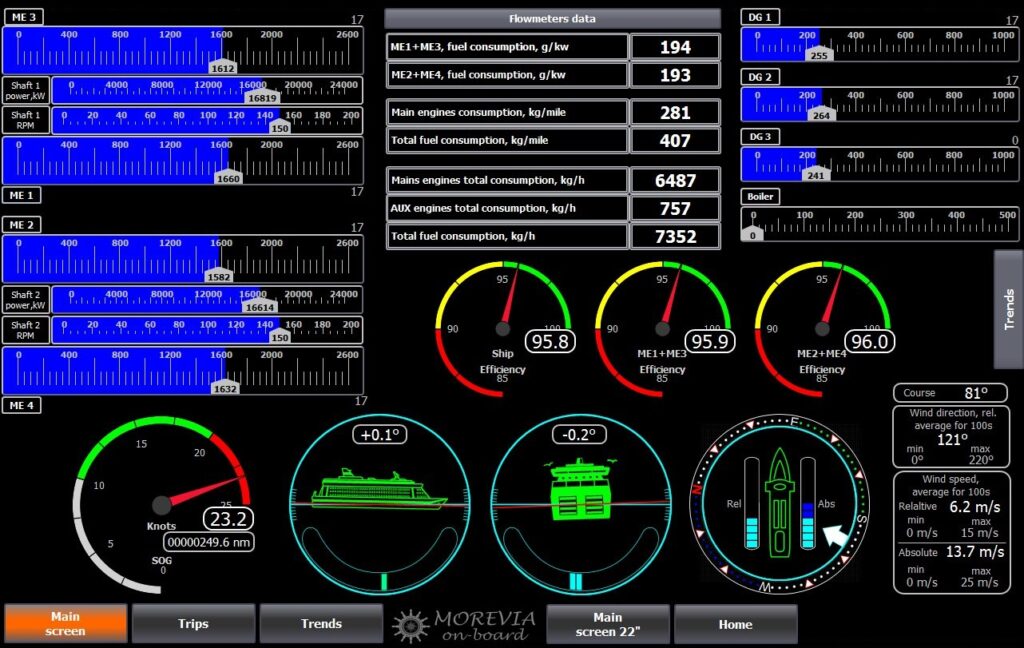
All data on consumptions, speed, wind power and direction, ship position and efficiency is available. All data is displayed both in graphical and digital mode.
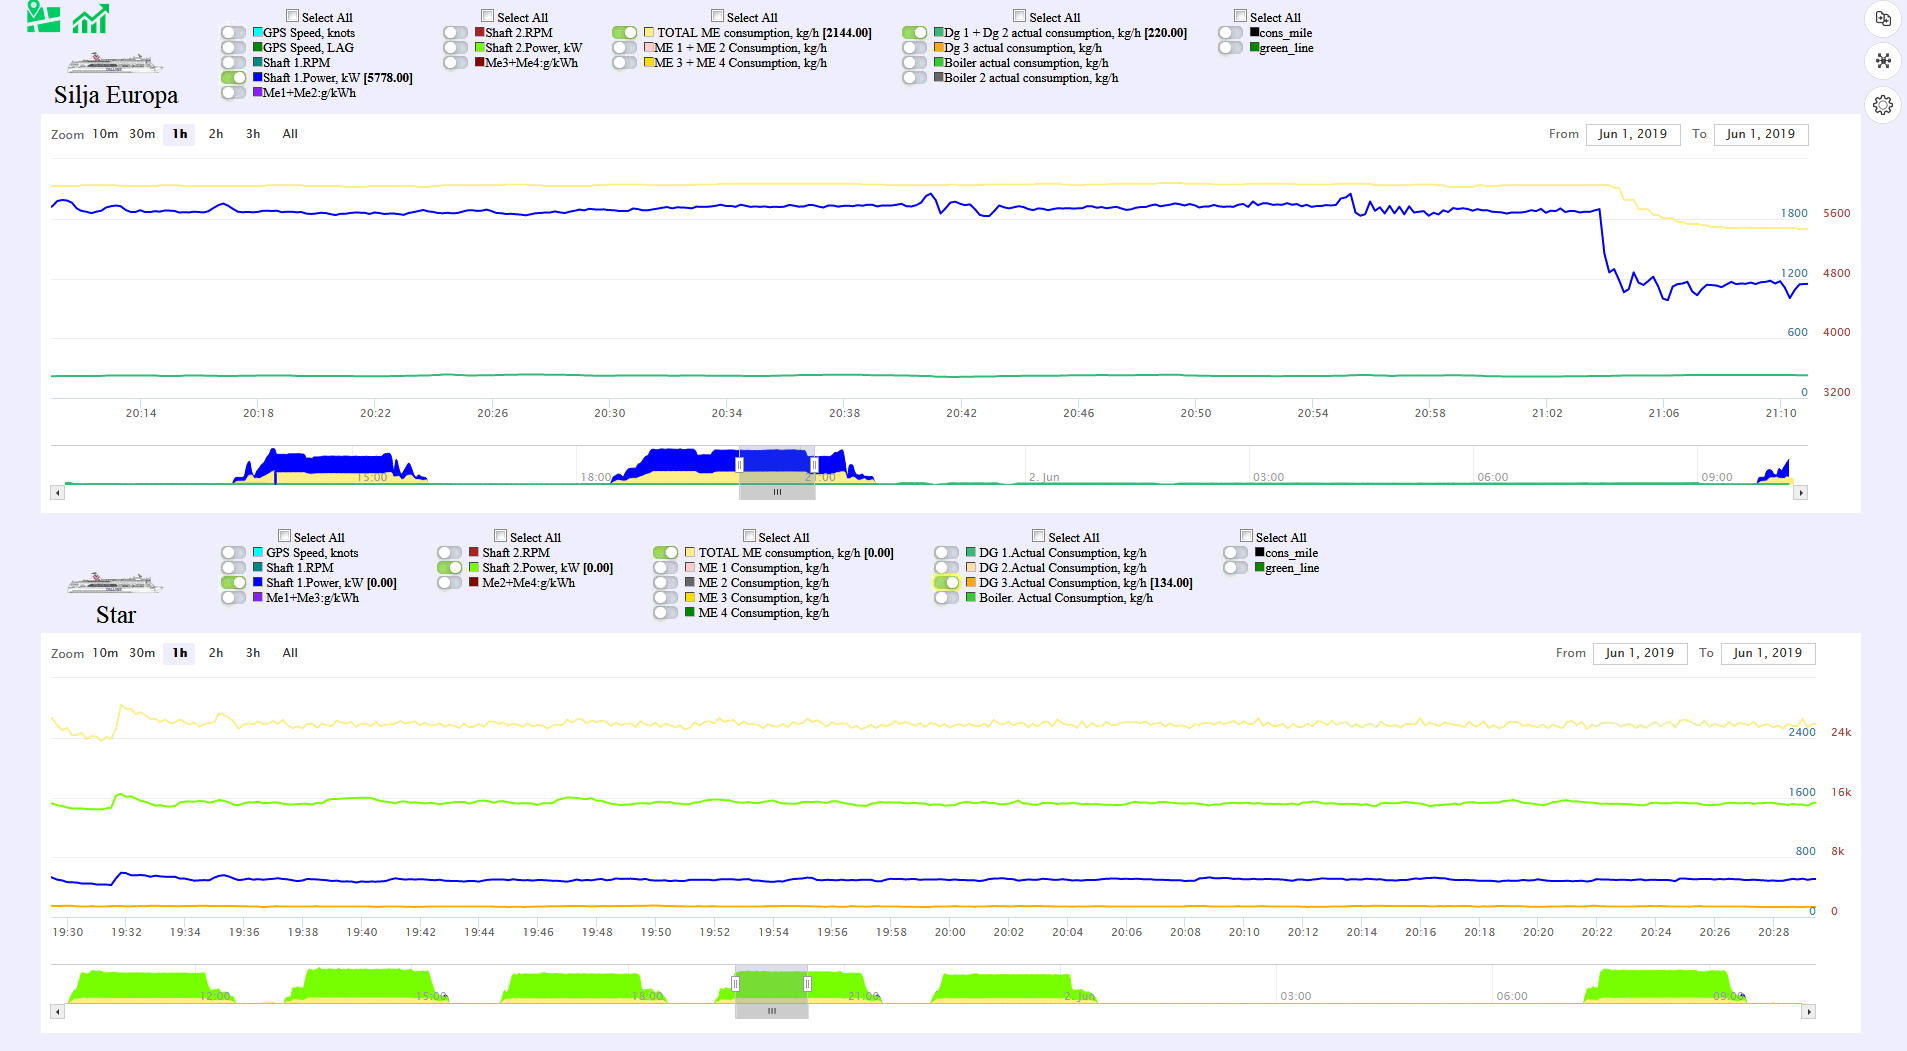
Navigators or their representatives can compare the ships operation using a convenient graphic comparison form where all data from the system MOREVIA can be displayed. FMS is especially beneficial for shipping cruise companies that travel on the same route, for example, ferries.
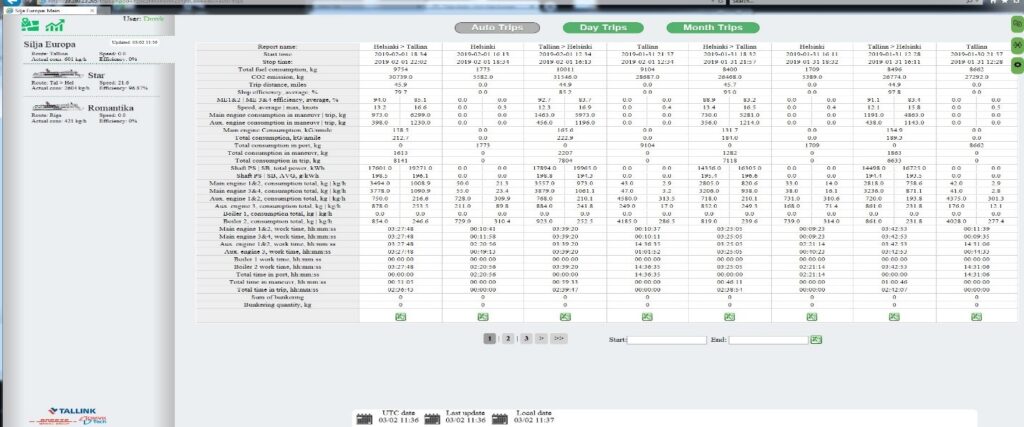
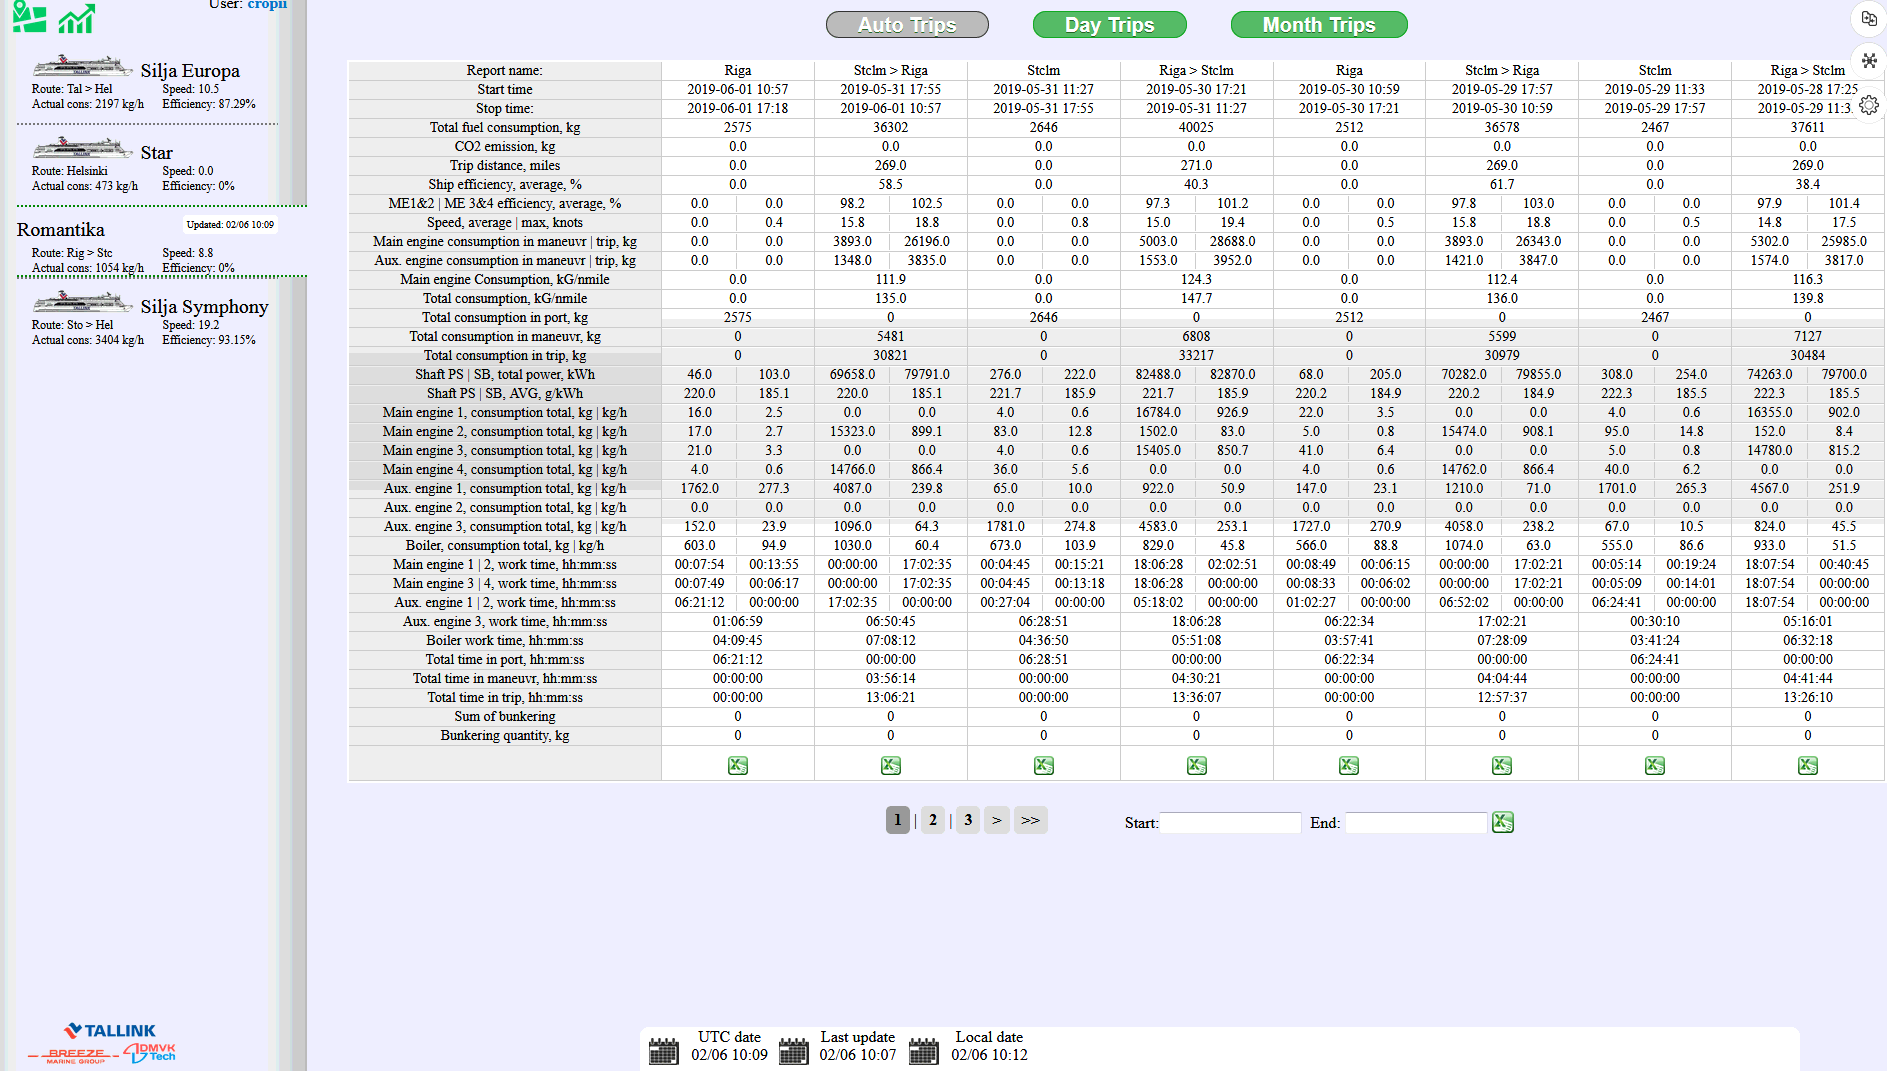
Summary reports on fuel consumption, equipment service hours, distance travelled and work efficiency are always available for a ship owner and crew. These reports are created and saved daily, weekly and monthly in the system automatically.
Optionally, the ship owner can get additional data, for instance, alarm signals, fuel remain in tanks, service work fulfilment.
Engine and ship work efficiency calculation
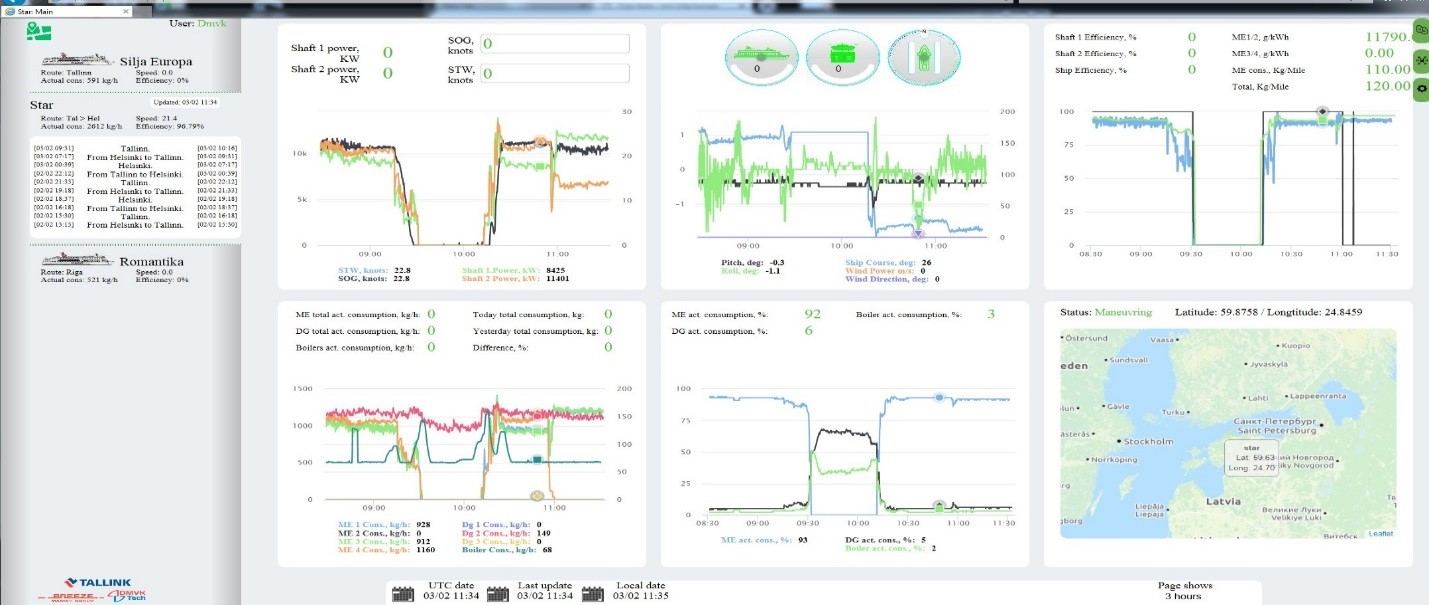
MOREVIA system provides work efficiency calculation based on fuel consumption record, ME and DG power record and other parameters. The system can consider wind power and direction, stream (based on log data), draft, heel and trim of the vessel. Besides, the system considers data from torsometers and Kilowatt meters. Based on this data and collected statistics, the system calculates the ship work efficiency. Moreover, by integrating the system of work efficiency calculation into the main engine management system, MOREVIA system can start or stop additional engines automatically.
MOREVIA provides automatic generation of single reports for printing and summary reports for data analysis. The reports are generated daily, monthly and when leaving a port. Record of different types of fuel, indicating operation time on each of the type of fuel, is also possible. Time and coordinates when switching between fuel types are recorded, as well.
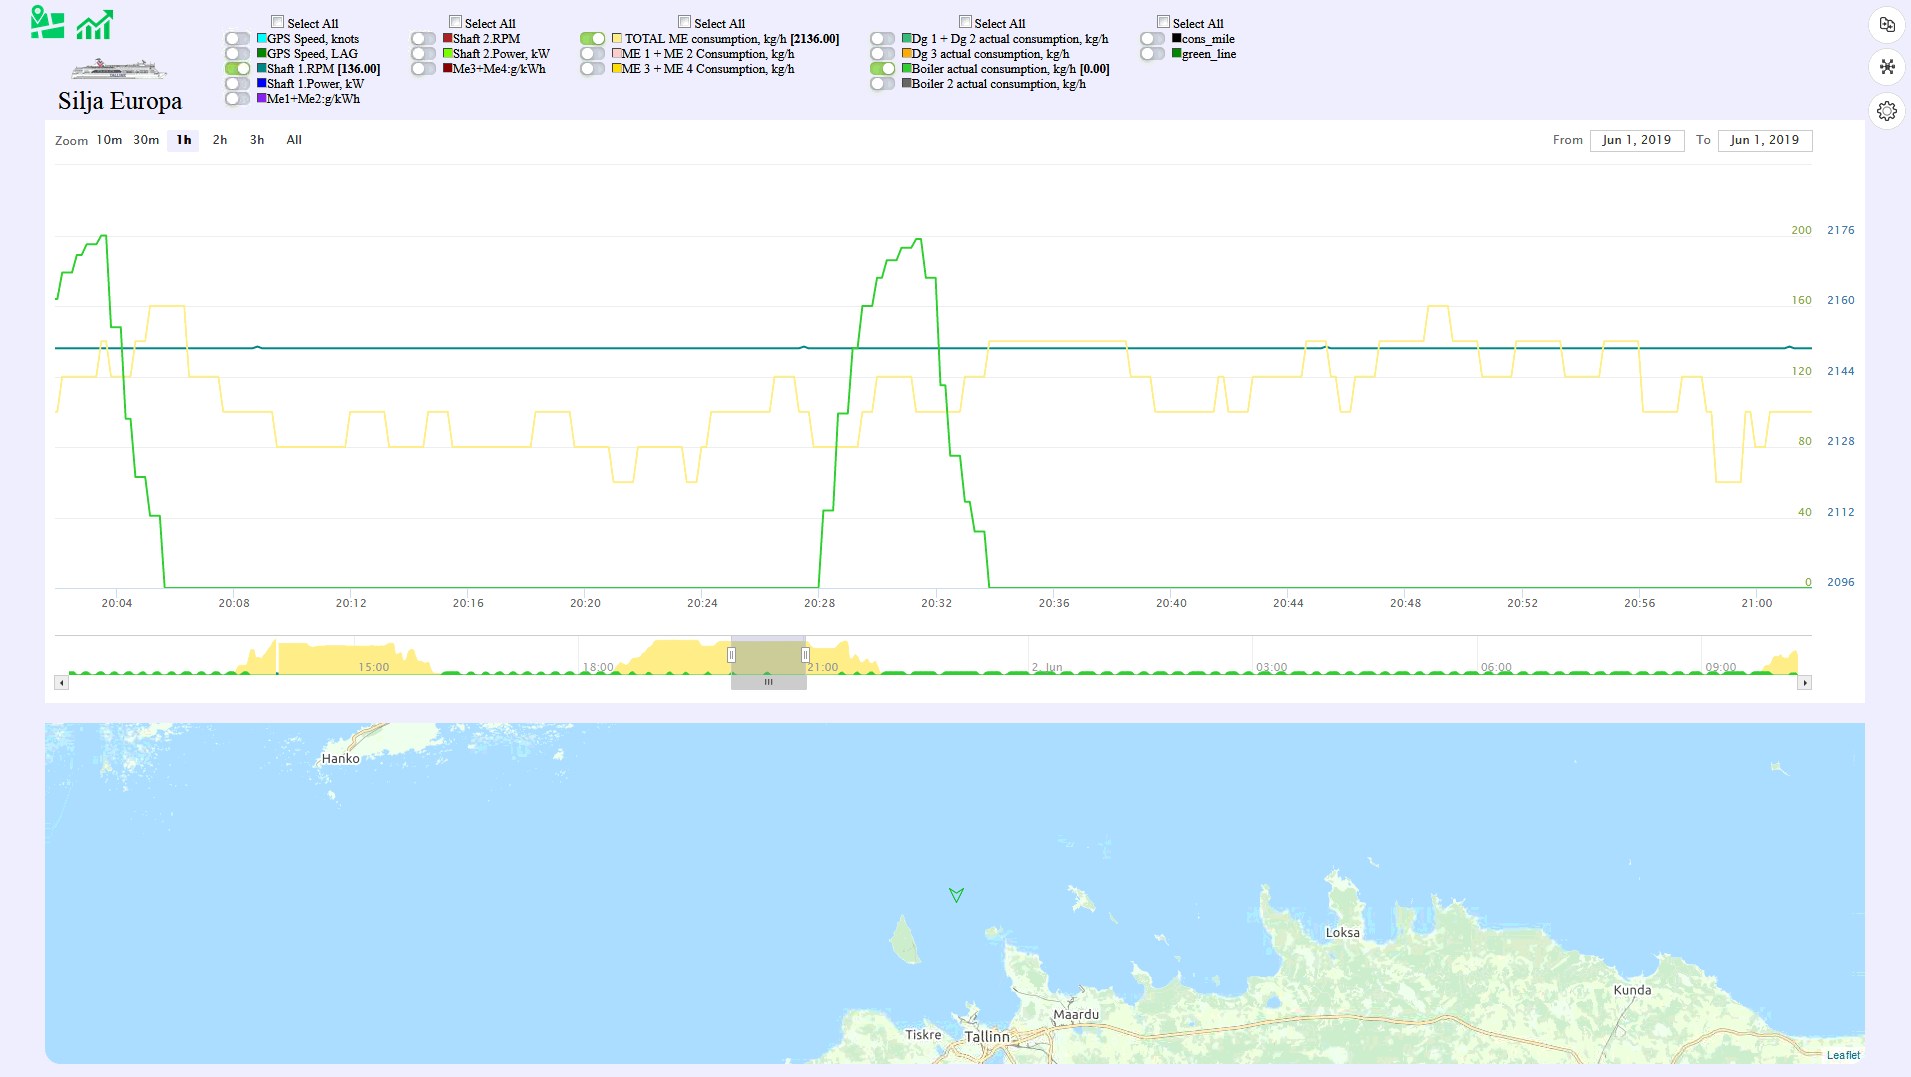
All data on fuel consumption, speed, power and other parameters is available both in the online mode and in the history mode for the last three years. The data is displayed in an easy graphical mode (trends) with a connection to a geographical position.
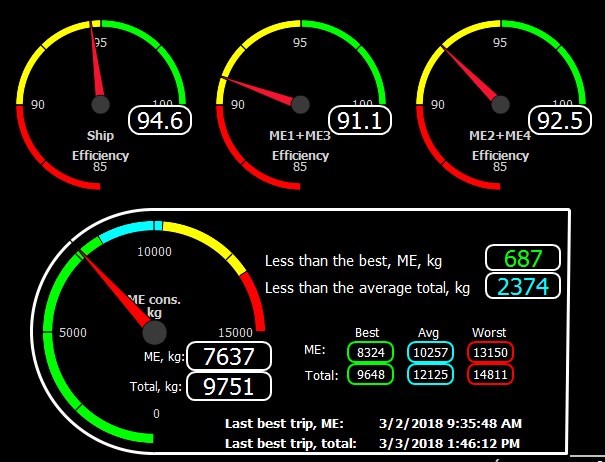
The system of best trips compares data for the last 30 days and provides the information about the best fuel consumption for the given route that motivates to eco-sailing. The best trip results are transmitted to a navigator and office.
Talk to us
Have any questions? We are always open to talk about new projects, creative opportunities and how we can help you.